Ever looked back at a trade and thought, “That setup was so obvious… how did I miss it?” Yeah, same here. Truth is, spotting the move too late is every trader’s nightmare—and it happens when you’re trapped in the wrong time frame.
In this breakdown, I will show you exactly how different time frames shape your edge, how to avoid common time trap mistakes, and how top traders layer multiple views to see what retail eyes can’t.
“I Could’ve Nailed That Trade!” Stop Hindsight Trading & Master Time Frames
We’ve all been there, haven’t we? That familiar pang of regret as you stare at a chart, seeing the perfect entry, the textbook breakout, or the clean reversal… all after it’s already happened. That’s clear hindsight for you, but only when it’s too late to act. I remember pulling up a chart countless times the next morning, muttering to myself, “Man, I saw that coming! Why didn’t I jump in?” It’s a universal frustration for traders.
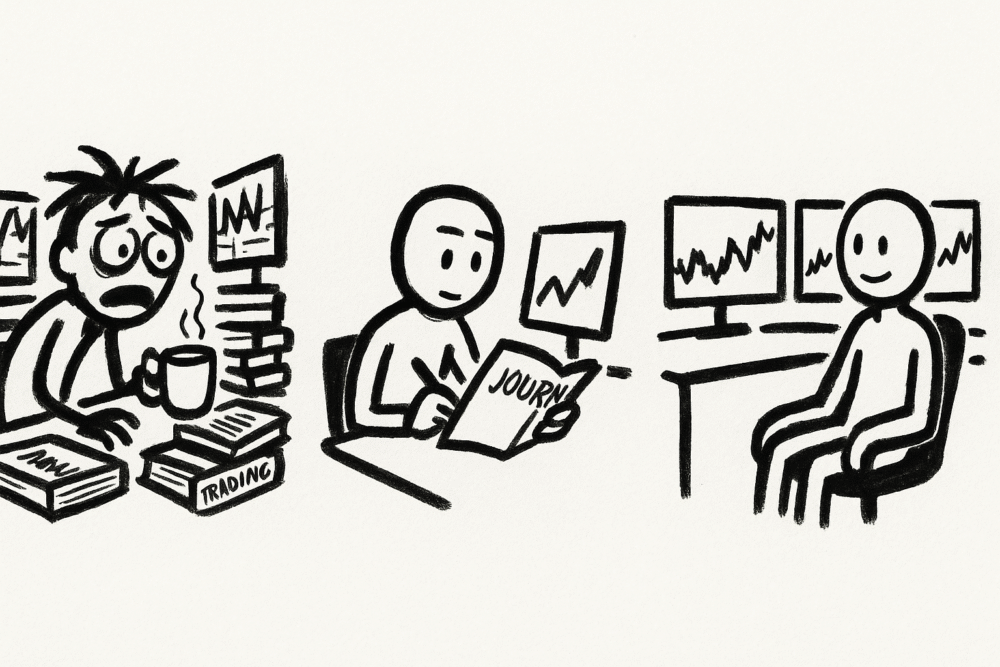
When I first started, I was obsessed. I spent hours trying to predict the market’s next big move. My desk was buried under books on indicators, and I tried to master every chart pattern imaginable. I convinced myself that if I just had enough screens and enough coffee, I’d spot the next breakout before anyone else. It was exhausting, and frankly, it didn’t work.
But here’s the truth I eventually learned, and what pros don’t trade like that.
They don’t stress over every single tick, nor do they try to outguess the market. Instead, their focus is on positioning. It’s about getting into setups where the risk/reward is favourable and managing their downside. And a huge part of gaining that edge? Using the correct time frame for the job.
The time frame you’re looking at can genuinely make or break your trade. Trying to trade off a 1-minute chart versus a weekly one is an entirely different ballgame. What looked like pure noise when I was trying to swing trade might be absolute money in the bank for a scalper. That’s why understanding how time frames affect your specific strategy is vital.
Short-Term Trading: The Three Styles We Use
Let’s be clear: not all short-term trading is the same. There’s scalping, day trading, and swing trading—each one demands a distinct mindset, a different time commitment, and a particular set of time frames. I’ve dabbled in all three; each felt like learning a new language.
Swing Trading: My “Patient” Short-Term Play
For me, swing trading has always felt like the most relaxed form of short-term trading. You’re holding positions for a few days, maybe a few weeks. I’m not glued to the screen watching every tick. Instead, I watch trends unfold on the daily (D1) and 4-hour (H4) charts. Sometimes, I’ll even zoom out to the weekly (W1) chart to spot those massive levels that could make or break a trend.
I learned not to panic over overnight gaps. It’s all about managing total exposure, sticking to my pre-defined setups, and not letting emotions dictate my actions.
Day Trading: In and Out Before the Bell Closes
Day trading is where the energy picks up. Every position is closed before the day ends—no overnight risk. When I’m day trading, I’m living and breathing intraday volatility, building trades around the 5-minute (M5) to 1-hour (H1) charts, often using 15-minute (M15) setups for that extra confirmation.
News releases, obvious technical patterns, sudden volume spikes—that’s my fuel for day trades. Trust me, risk management is incredibly tight here: I’m talking about hard stops and strict size limits because a bad day trade can wipe out a lot of hard work.
Scalping: Blink and You Miss It
Scalping is an adrenaline rush like no other. It’s all about speed and precision. You’re in, you’re out—sometimes in under a minute. I’ve used the 1-minute (M1), 5-minute (M5), and 15-minute (M15) charts religiously when scalping. Some days, I’d hit dozens, even hundreds, of trades.
It’s not for the faint of heart. You need lightning-fast execution, rock-solid discipline, and zero hesitation. I remember one session where I lost focus for a second, which was enough to turn a winning streak into a quick loss. It’s unforgiving.
So, what exactly are trading time frames?
Think of time frames as different ways to slice price action into individual candles. Each candle shows you the open, high, low, and close for a specific period.
Here’s the standard toolkit we use, and what I’ve personally come to rely on:
- M1 – Every candle represents 1 minute of price action
- M5 – 5 minutes
- M15 – 15 minutes
- M30 – 30 minutes
- H1 – 1 hour
- H4 – 4 hours
- D1 – Daily
- W1 – Weekly
- MN – Monthly
Different time frames reveal different things. Want to see all the noise and quick setups? Head to the M1. Want to spot the dominant, overarching trend? The D1 or W1 are your go-to.
Here’s the kicker, and something I had to learn the hard way: no single time frame is inherently “better” than another. The only “right” one is the one that perfectly fits your trading strategy.
Best Time Frames for Each Style: My Guide
Let’s break down which time frames I’ve found work best, depending on how you like to trade.
🟠 For Scalpers:
- M1: This is where the micro-moves happen. I use it for precise entries and exits, often just riding a few ticks.
- M5: Great for spotting mini-trends that last a few minutes, or finding confluence before a quick scalp.
- M15: I use this to zoom out just enough. It helps me avoid tunnel vision and gives me a slight sense of the immediate market direction without being too slow.
As a scalper, your execution has to be lightning-fast. If my broker’s lagging even a second, I know I’m toast.
🔵 For Day Traders:
- M5: This is my sweet spot for most intraday setups. It moves fast enough for action but isn’t as chaotic as the M1.
- M15: I use this for confirmation. If I see a setup on the M5, I’ll often check the M15 to cut through some of the noise and confirm the move.
- M30 is ideal for my pre-market planning. Before the market opens, I’ll look for clear trends and significant levels.
- H1: This chart helps me track broader intraday momentum and key daily levels. It’s like my overall guide.
🟢 For Swing Traders:
- H4: This is my primary chart for entry/exit decisions, especially when looking at key zones.
- D1: This is my bread-and-butter trend chart. I use it to identify and follow the primary trend.
- W1: I always zoom out to the weekly to frame my trades in the bigger picture. It gives me crucial context and helps me understand whether I’m fighting or riding a significant trend.
- MN: I use the monthly chart primarily for context, especially if I’m thinking about very long-term positions or major macro-driven moves, but it’s rarely my primary decision-making chart.
How Pros Use Multiple Time Frames (MTFA): My Secret Weapon
This is where you truly level up your trading, and it’s something I wish I’d learned much earlier.
Let’s say I’m prepping for a swing trade. I don’t just jump in based on what the D1 chart tells me. I use a “three-layer” approach with time frames:
- W1 (Weekly Chart): First, I establish the big-picture trend and identify any primary long-term levels. This gives me my macro view—the ocean currents, so to speak.
- D1 (Daily Chart): Then, I look for signals that align with that weekly trend. This is my daily view—the waves within those currents.
- H4 (4-Hour Chart): Finally, I use this lower time frame to pinpoint my exact entry and set my risk parameters (stop loss, take profit). This is my micro view—the perfect spot to surf that wave.
You get a macro, meso, and micro view of the same asset. It’s how we confirm our conviction in a trade and dramatically reduce false signals. It’s the difference between guessing and truly understanding the market.
Do you have a go-to time frame you rely on most, or are you looking to integrate more time frames into your current strategy?


